Now that we have seen all the background information that ESI Truck can provide, Bosch takes us through its diagnostic process.
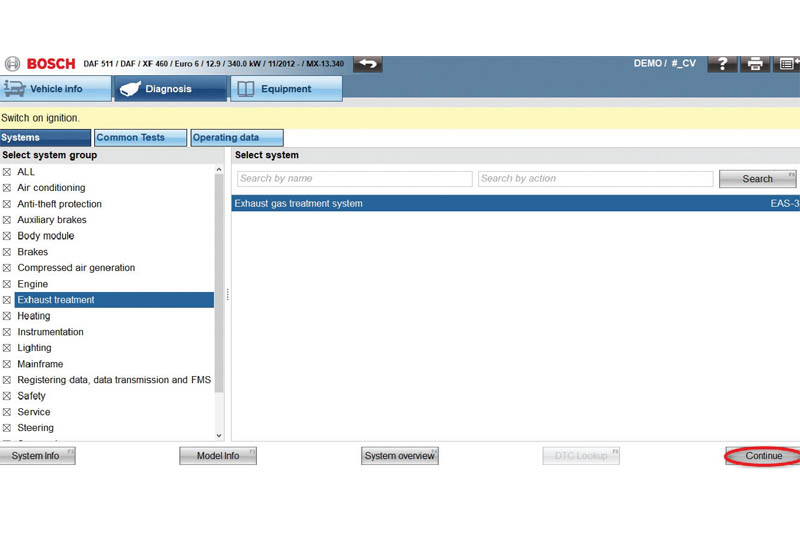
Following vehicle selection, the list of available systems is shown and, from here, you can choose one system on which to run diagnostics. In this example, we will look at the Exhaust Gas Treatment System (Fig. 1).
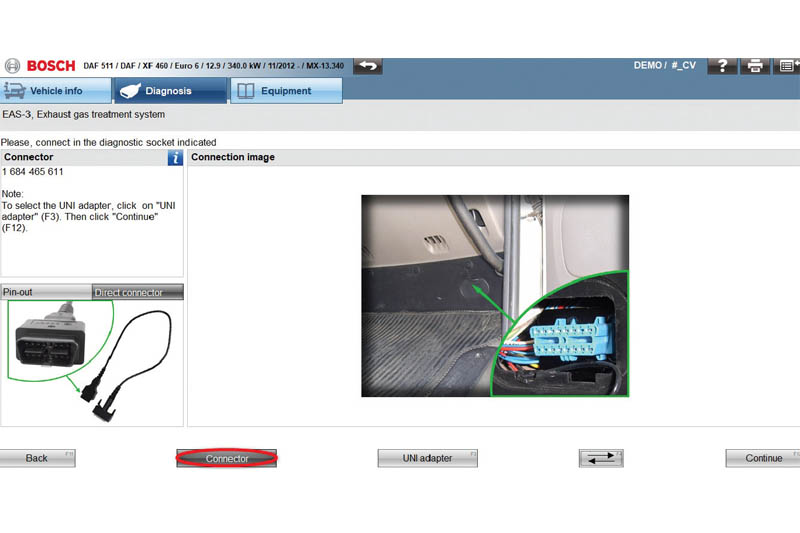
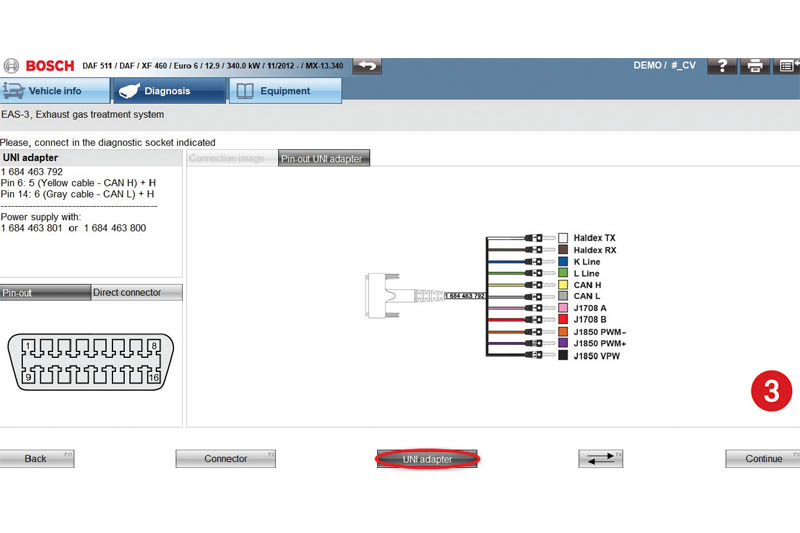
As mentioned in the Bosch system overview article, it is important that diagnosis is started from the screen showing the correct method of connection between the KTS and the vehicle. In this case, there are two options: standard OBD (Fig. 2) or using the UNI adapter to connect to the specific pins (Fig. 3). At all times during diagnosis, the button circled in red can be used to show any additional Model Info or System Info as we have previously discussed.
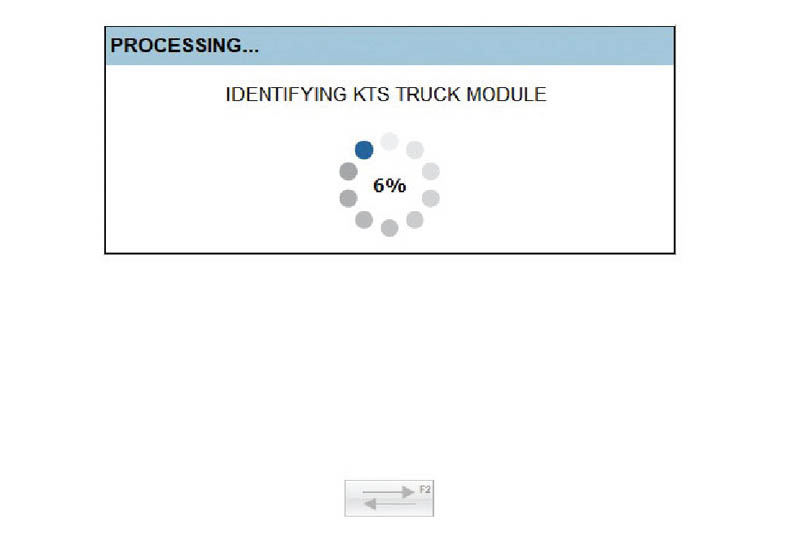
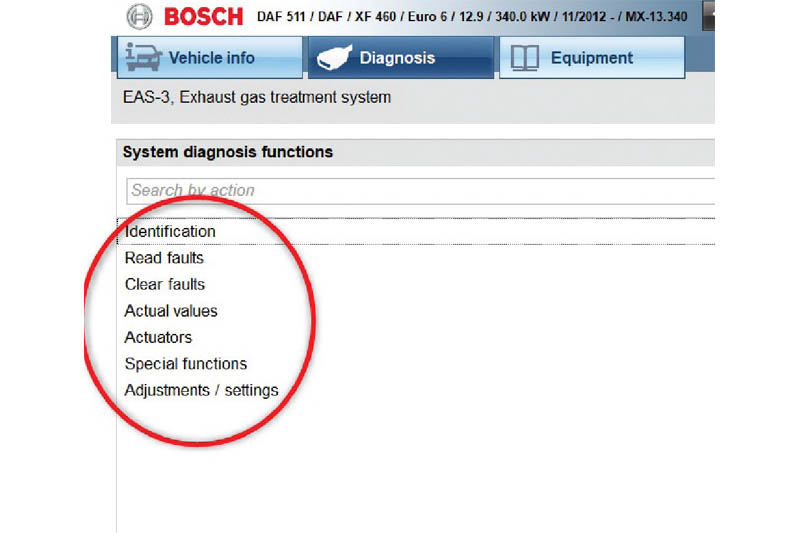
Once diagnosis is started, the software looks for the KTS (Fig. 4) and, once it has a connection, several options will be available (Fig. 5):
- Identification
- Read faults
- Clear faults
- Actual values
- Actuators
- Special functions
- Adjustments/settings
Identification
This function provides background information to the system. For example, in this case, we can look at Diesel Particulate Filter or ECU Data. The diesel particulate filter option will show the data history for the DPF while the ECU data gives exactly that – ECU name, chassis number, VIN code, etc.
Read faults
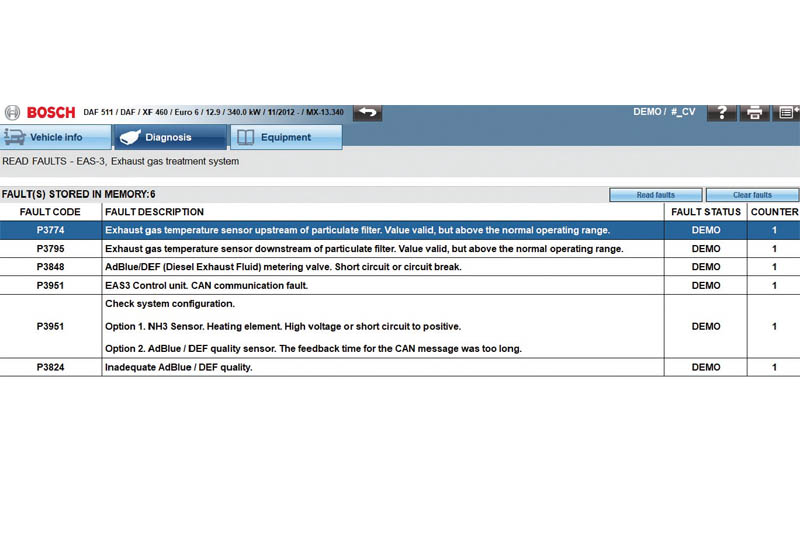
If there are any faults in the system, they will be shown here. The overall fault code table can be saved to the vehicle’s protocol for future reference or to give the customer a more detailed view of what work has been carried out and why (Fig. 6). Once a fault is selected, the troubleshooting button can guide you through a test procedure to identify and fix the fault.
Clear faults
Following the troubleshooting process, this function can be used to clear the faults from the ECU memory so that the vehicle knows that it has been fixed correctly.
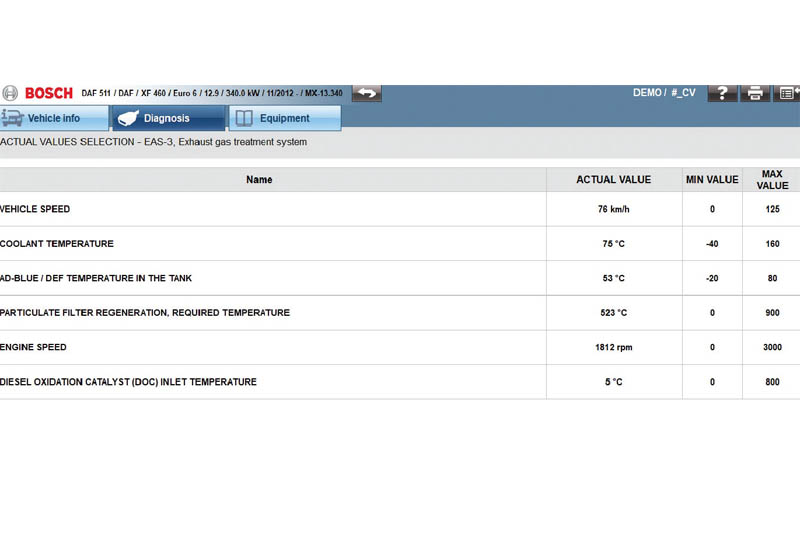
Actual values
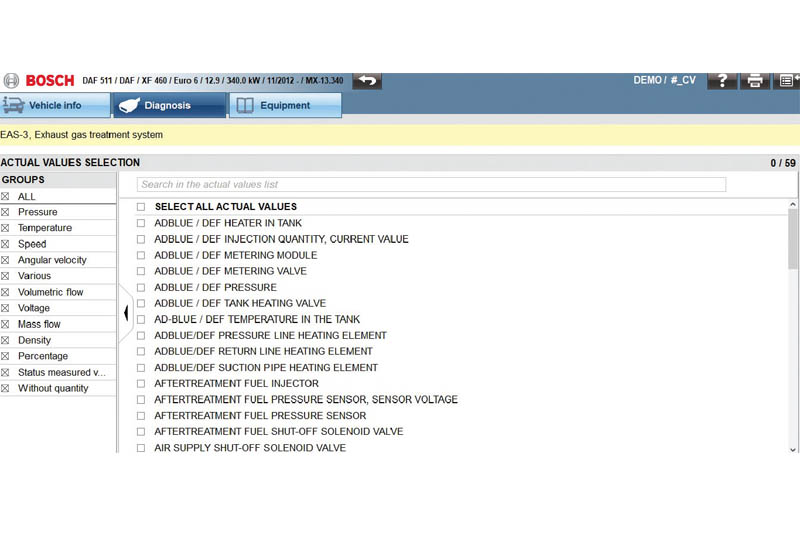
There are several ways of displaying the actual values available for this system. Actual Values Selection allows you to choose specific values to measure (Fig. 7). These can then be shown in a standard table format (Fig. 8), in a cockpit view (Fig. 9), or be plotted live onto a graph (Fig. 10).
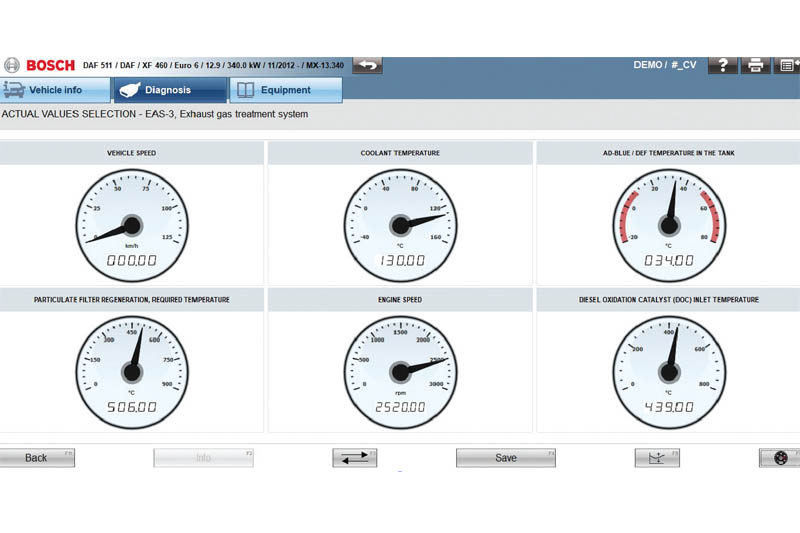
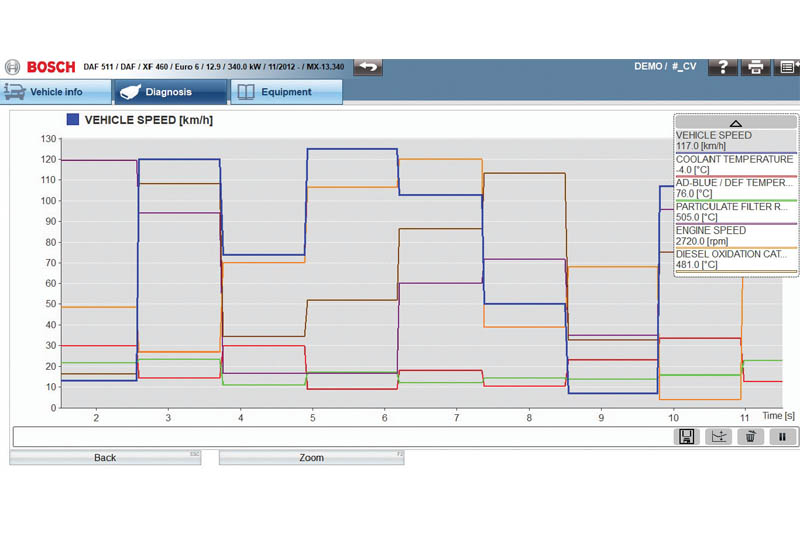
All three of these views can be saved onto the vehicle’s protocol. System Display shows a picture of the system and how everything is connected together with live readings of the values at each critical point (Fig. 11).
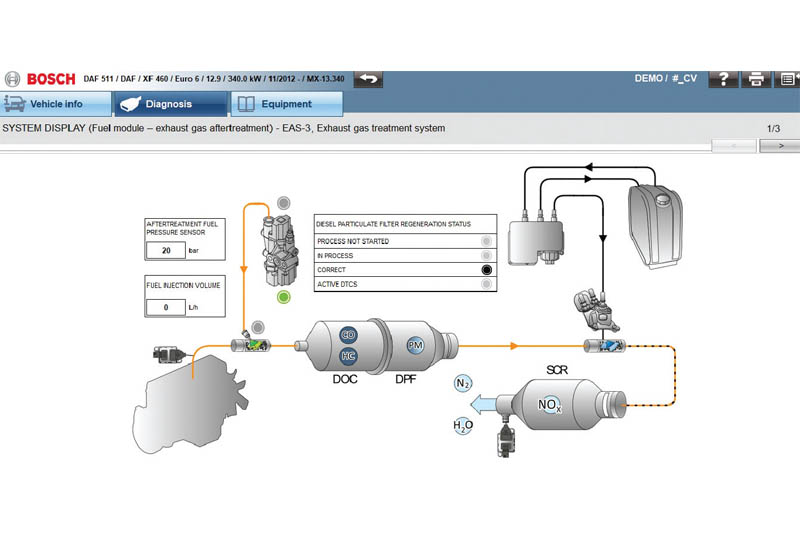
There can be several screens for this, depending on how much information is available. User Defined Groups can be used as a quick method of selecting the actual values which you use the most with this specific vehicle.
Actuators
Depending on the vehicle, there will be a varying number of available actuators to perform additional tasks or to check certain components.
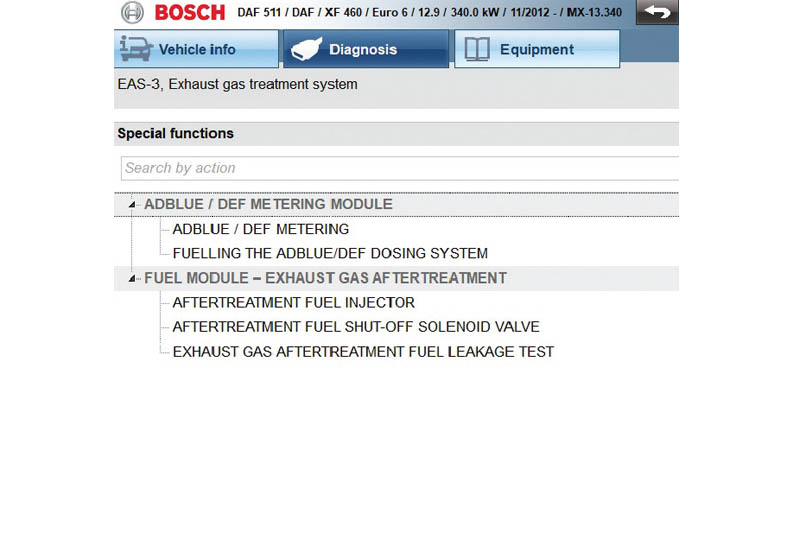
Special functions
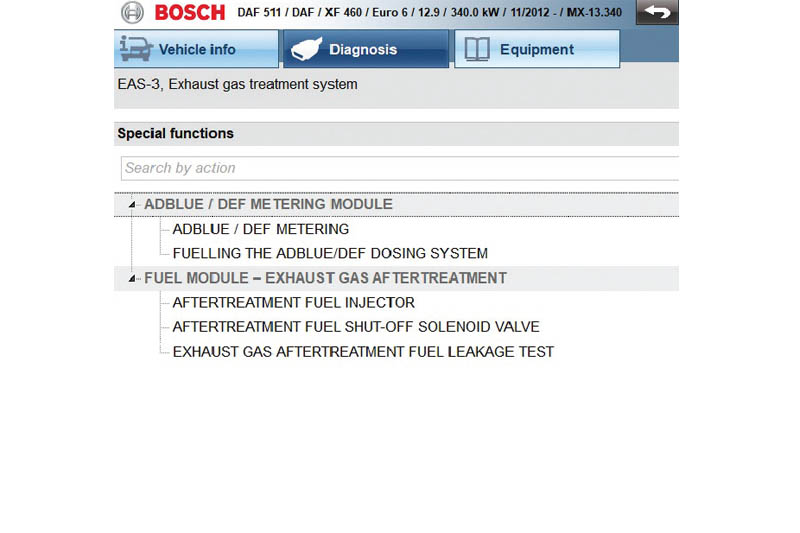
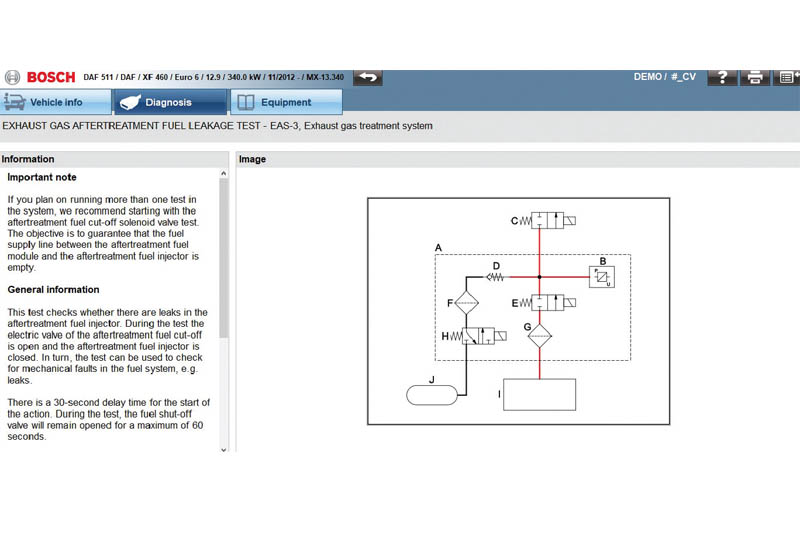
This section will allow you to perform specific tests which are applicable to the vehicle and system chosen for diagnosis (Fig. 12 and 13).
Adjustments/settings
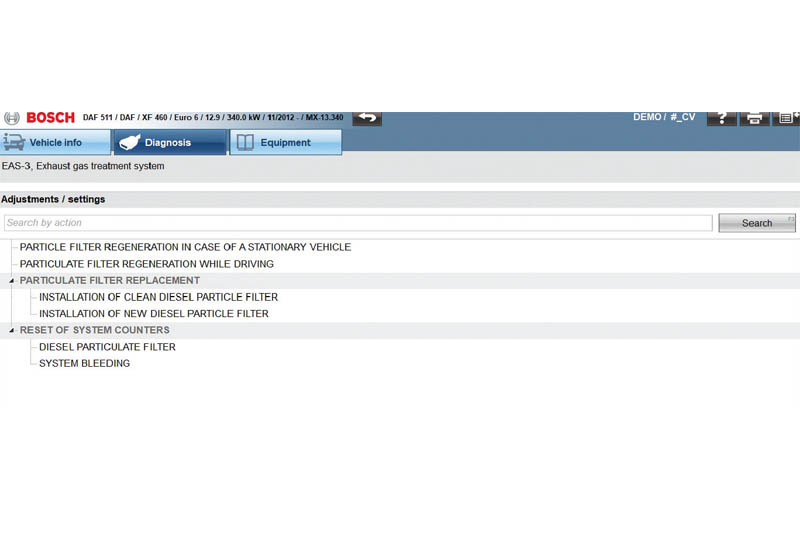
Occasionally there are tasks which need further adjustments and these will be shown on this screen (Fig. 14). It could be possible that changing some parameters will require you to have Advanced Mode released, which we will cover in the next edition of KTS Truck made ESI.


